警告
本文最后更新于 2020-07-27,文中内容可能已过时。
pprof 用来做 Go 程序的性能监控,让我们知道在什么地方耗费了多少 CPU、memory。
pprof 关注的方面有:
- CPU profile:报告程序的 CPU 使用情况,按照一定频率去采集应用程序在 CPU 和寄存器上面的数据
- Memory Profile(Heap Profile):报告程序的内存使用情况
- Block Profiling:报告 goroutines 不在运行状态的情况,可以用来分析和查找死锁等性能瓶颈
- Goroutine Profiling:报告 goroutines 的使用情况,有哪些 goroutine,它们的调用关系是怎样的
1. 引入
pprof 可以从以下两个包中引入:
1
2
| import "net/http/pprof"
import "runtime/pprof"
|
其中 net/http/pprof 底层使用 runtime/pprof 包,只是进行了一下封装,并在 http 端口上暴露出来。
如果我们的服务是一直运行的,如 web 应用,通过简单的导入 import _ "net/http/pprof",就可以在运行 web 应用后在浏览器 http://localhost:port/debug/pprof 直接看到当前 web 服务的状态,包括 CPU 占用情况和内存使用情况等。
如果我们的程序不是 web 应用,而是一个服务进程,那么可以导入 net/http/pprof 包,然后主动开启一个 Goroutine 在端口进行监听
1
2
3
| go func() {
log.Println(http.ListenAndServe("localhost:6060", nil))
}()
|
如果我们的程序只是简单的 Go 程序,那么只能使用 runtime/pprof 包,具体做法是在代码中加入下面这段程序,然后在运行时(go run 或 go build等命令)加入 –cpuprofile 参数,比如 go run demo.go --cpuprofile=demo.prof
 1
 2
 3
 4
 5
 6
 7
 8
 9
10
11
12
13
| var cpuprofile = flag.String("cpuprofile", "", "write cpu profile to file")
func main() {
flag.Parse()
if *cpuprofile != "" {
f, err := os.Create(*cpuprofile)
if err != nil {
log.Fatal(err)
}
pprof.StartCPUProfile(f)
defer pprof.StopCPUProfile()
}
...
|
命令执行完后当前目录会生成 demo.prof 文件,其中记录了 CPU 运行的信息,下一步就可以利用该文件查看相关的信息,使用 go tool pprof 命令来执行,如果要进行可视化,需要安装 graphviz
win10 下可以使用 chocolatye 或 winget 安装,如下
1
2
3
| > choco install graphviz
# 或
> winget install graphviz
|
2. 分析普通程序
主要参考的文章是 Go Post 中的 Profiling Go Programs
测试代码来自于 https://github.com/rsc/benchgraffiti/tree/master/havlak
我们使用 go mod 建立了一个测试项目文件夹,第一次使用测试代码中的 havlak1.go 文件,将该文件复制到测试项目根目录。由于其中已经引入了 runtime/pprof 包并包含了如下代码,我们不需要做修改,执行执行
 1
 2
 3
 4
 5
 6
 7
 8
 9
10
11
12
13
| var cpuprofile = flag.String("cpuprofile", "", "write cpu profile to file")
func main() {
flag.Parse()
if *cpuprofile != "" {
f, err := os.Create(*cpuprofile)
if err != nil {
log.Fatal(err)
}
pprof.StartCPUProfile(f)
defer pprof.StopCPUProfile()
}
...
|
执行时加入 –cpuprofile=havlak1.prof 参数
1
2
3
4
5
6
7
| $ go build havlak1.go
$ ./havlak1 --cpuprofile=havlak1.prof
# of loops: 76000 (including 1 artificial root node)
$ ls
go.mod havlak1.exe havlak1.go havlak1.prof
|
然后运行 go tool pprof 命令与 profile 交互
1
2
3
4
5
6
7
| $ go tool pprof havlak1.exe havlak1.prof
File: havlak1.exe
Type: cpu
Time: Jul 25, 2020 at 7:23pm (CST)
Duration: 21.52s, Total samples = 34.77s (161.56%)
Entering interactive mode (type "help" for commands, "o" for options)
(pprof)
|
最主要的命令是 topN ,用来输出最耗 CPU 的前N个调用
 1
 2
 3
 4
 5
 6
 7
 8
 9
10
11
12
13
14
15
16
| (pprof) top10
Showing nodes accounting for 21340ms, 61.37% of 34770ms total
Dropped 168 nodes (cum <= 173.85ms)
Showing top 10 nodes out of 89
flat flat% sum% cum cum%
5340ms 15.36% 15.36% 12320ms 35.43% runtime.scanobject
3190ms 9.17% 24.53% 3650ms 10.50% runtime.mapaccess1_fast64
2650ms 7.62% 32.15% 16670ms 47.94% main.FindLoops
2240ms 6.44% 38.60% 3320ms 9.55% runtime.findObject
1800ms 5.18% 43.77% 2920ms 8.40% runtime.greyobject
1490ms 4.29% 48.06% 6540ms 18.81% runtime.mallocgc
1480ms 4.26% 52.32% 4230ms 12.17% main.DFS
1230ms 3.54% 55.85% 3510ms 10.09% runtime.mapassign_fast64ptr
1000ms 2.88% 58.73% 1450ms 4.17% runtime.heapBitsSetType
920ms 2.65% 61.37% 1050ms 3.02% runtime.spanOf (inline)
(pprof)
|
- flat、flat% 表示函数在 CPU上运行的时间及百分比
- sum% 表示列表中自己包括前面的函数CPU使用比例的累积,比如第三行 main.FindLoops 显示的 32.15% 其实就等于前面三个调用的比例之和 15.36% + 9.17% + 7.62% = 32.15%
- cum、cum% 表示该函数及其子函数运行所占的时间总和及比例总和,应该大于等于自己执行所占的时间和比例,也就是最前面两列
添加 -cum 参数可以按照 cum 来排序
 1
 2
 3
 4
 5
 6
 7
 8
 9
10
11
| (pprof) top5 -cum
Showing nodes accounting for 2.67s, 7.68% of 34.77s total
Dropped 168 nodes (cum <= 0.17s)
Showing top 5 nodes out of 89
flat flat% sum% cum cum%
0 0% 0% 16.79s 48.29% main.main
0 0% 0% 16.79s 48.29% runtime.main
0 0% 0% 16.67s 47.94% main.FindHavlakLoops (inline)
2.65s 7.62% 7.62% 16.67s 47.94% main.FindLoops
0.02s 0.058% 7.68% 15.16s 43.60% runtime.systemstack
(pprof)
|
实际上 main.FindLoops 和 main.main 的总和应当为 100%,但是 pprof 不会统计所有的调用,递归调用层次过深的一些执行会被忽略。
另外,使用 web 命令可以生成调用关系图,是一个 svg 文件,可视化的方式可以帮助我们更好的理解,该命令需要 graphviz 工具的支持,这也是为什么前面要安装它
执行该命令后图片会自动打开
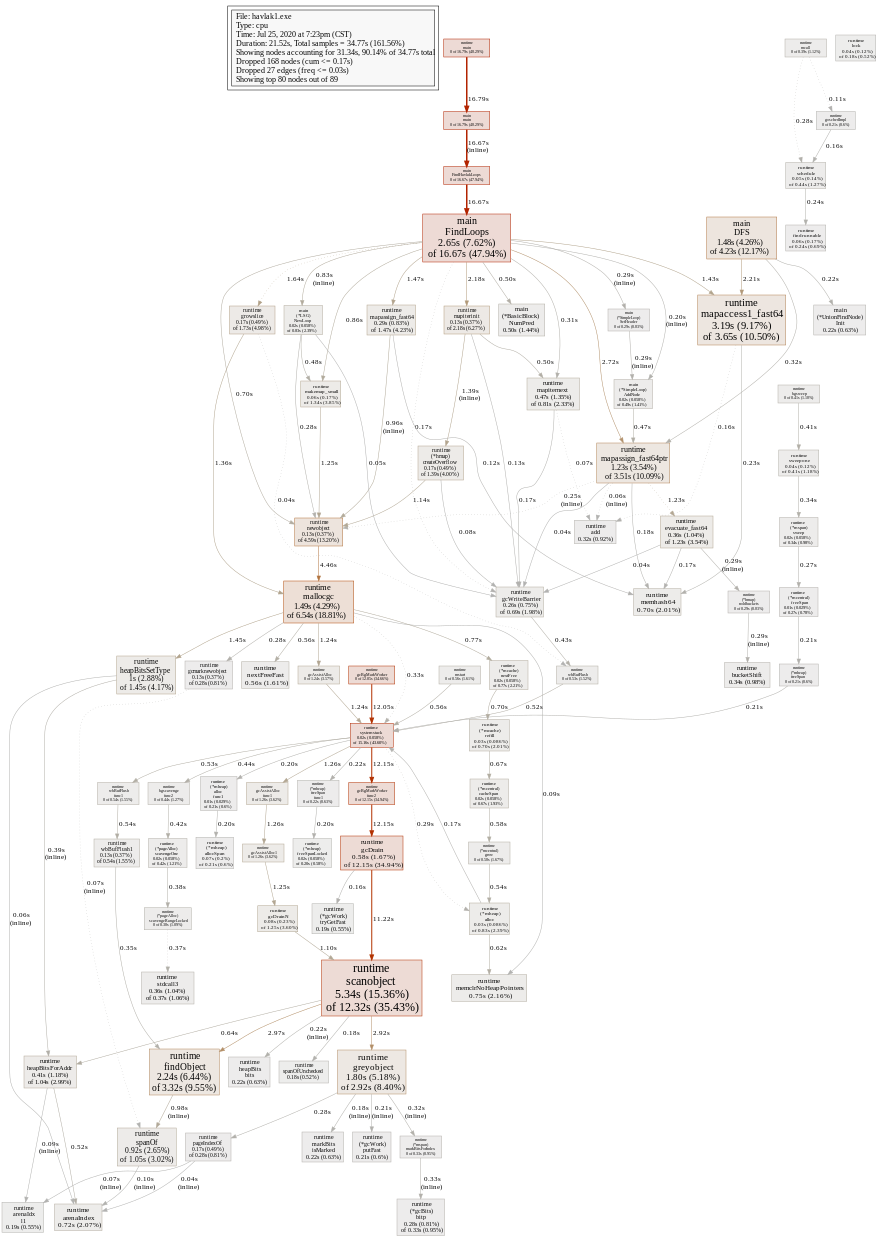
图片中每个方框都代表一个函数,方框的大小根据 CPU 占用比例确定,箭头表示调用关系,从上到下调用层次逐渐加深,表示调用的线条上出现的数字表示调用次数,递归调用自身会有一个自己指向自己的箭头。
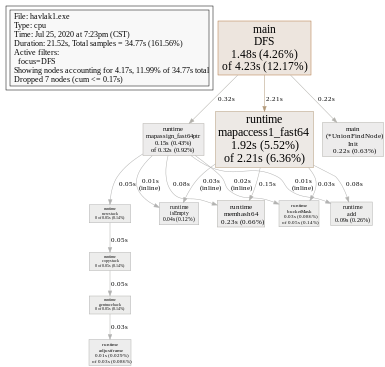
从图中看到 mapaccess 占用比例较大,我们可以只显示与它相关的调用,从而使图片逻辑更清晰。可以看到 mapaccess1 主要由 main.FindLoops 和 main.DFS 调用。
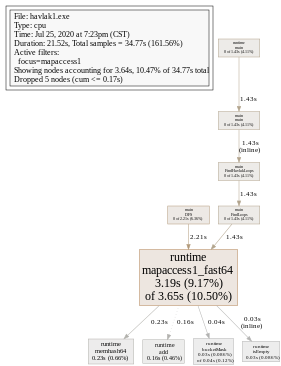
我们还可以通过指定函数进入某个函数的细节,DFS逻辑比较简单,以它为例
也可以使用命令
 1
 2
 3
 4
 5
 6
 7
 8
 9
10
11
12
13
14
15
16
17
18
19
20
21
22
23
24
25
26
27
| (pprof) list DFS
Total: 34.77s
ROUTINE ======================== main.DFS in F:\Go-web\havlak1.go
1.48s 8.38s (flat, cum) 24.10% of Total
. . 233: return false
. . 234:}
. . 235:
. . 236:// DFS - Depth-First-Search and node numbering.
. . 237://
30ms 30ms 238:func DFS(currentNode *BasicBlock, nodes []*UnionFindNode, number map[*BasicBlock]int, last []int, current int) int {
20ms 240ms 239: nodes[current].Init(currentNode, current)
20ms 340ms 240: number[currentNode] = current
. . 241:
. . 242: lastid := current
1.02s 1.02s 243: for _, target := range currentNode.OutEdges {
190ms 1.73s 244: if number[target] == unvisited {
80ms 4.23s 245: lastid = DFS(target, nodes, number, last, lastid+1)
. . 246: }
. . 247: }
80ms 750ms 248: last[number[currentNode]] = lastid
40ms 40ms 249: return lastid
. . 250:}
. . 251:
. . 252:// FindLoops
. . 253://
. . 254:// Find loops and build loop forest using Havlak's algorithm, which
(pprof)
|
前两列分别是 flat 和 cum,也就是该行执行占用的时间和该行及该行调用的函数执行占用的总时间,第三列是源码行数。所以我们看到第 245 行由于出现了 DFS 这个递归函数,总占用时间为 4.23s,是最多的。除了该行之外,占用最多的就是第239、240、248三行,主要原因是映射的使用占用了大量时间,所以我们在使用中应尽可能使用数组和切片,而减少使用映射。
2. 时间与存储优化
将 DFS 函数参数中的 number 由映射更改为切片,可以将运行时间减少两倍,我们使用测试文件列表中的 havlak2.go,执行同样的测试过程可以验证这一点,原先的 DFS cum 是 4230ms,现在已经只有 830ms。
 1
 2
 3
 4
 5
 6
 7
 8
 9
10
11
12
13
14
15
16
17
18
19
20
21
22
23
24
25
26
| $ go build havlak2.go
$ ./havlak2 --cpuprofile=havlak2.prof
# of loops: 76000 (including 1 artificial root node)
$ go tool pprof havlak2.exe havlak2.prof
File: havlak2.exe
Type: cpu
Time: Jul 25, 2020 at 8:51pm (CST)
Duration: 12.36s, Total samples = 22.91s (185.34%)
Entering interactive mode (type "help" for commands, "o" for options)
(pprof) top10
Showing nodes accounting for 14360ms, 62.68% of 22910ms total
Dropped 132 nodes (cum <= 114.55ms)
Showing top 10 nodes out of 85
flat flat% sum% cum cum%
4130ms 18.03% 18.03% 9810ms 42.82% runtime.scanobject
1850ms 8.08% 26.10% 2570ms 11.22% runtime.findObject
1800ms 7.86% 33.96% 11070ms 48.32% main.FindLoops
1530ms 6.68% 40.64% 2510ms 10.96% runtime.greyobject
1450ms 6.33% 46.97% 5940ms 25.93% runtime.mallocgc
950ms 4.15% 51.11% 1290ms 5.63% runtime.heapBitsSetType
680ms 2.97% 54.08% 830ms 3.62% main.DFS
670ms 2.92% 57.01% 670ms 2.92% runtime.memclrNoHeapPointers
670ms 2.92% 59.93% 670ms 2.92% runtime.nextFreeFast
630ms 2.75% 62.68% 630ms 2.75% runtime.arenaIndex (partial-inline)
|
附: diff between havlak1 and havlak2
现在,DFS 不再是时间瓶颈,取而代之的是内存分配与垃圾回收,上面的结果中 runtime.mallocgc 占了一大部分。为了找出为什么垃圾回收时间占用这么多,我们来分析内存占用,这时候使用 memprofile ,不再是 cpuprofile。首先在主函数中替换如下部分
 1
 2
 3
 4
 5
 6
 7
 8
 9
10
11
12
13
| var memprofile = flag.String("memprofile", "", "write memory profile to this file")
...
FindHavlakLoops(cfgraph, lsgraph)
if *memprofile != "" {
f, err := os.Create(*memprofile)
if err != nil {
log.Fatal(err)
}
pprof.WriteHeapProfile(f)
f.Close()
return
}
|
然后使用 –memprofile 标志编译源码,此时使用测试文件列表中的 havlak3
附:diff from havlak2
 1
 2
 3
 4
 5
 6
 7
 8
 9
10
11
12
13
14
15
16
17
18
19
20
| $ go build havlak3.go
$ ./havlak3 --memprofile=havlak3.mprof
$ go tool pprof havlak3.exe havlak3.mprof
$ go tool pprof havlak3.exe havlak3.mprof
File: havlak3.exe
Type: inuse_space
Time: Jul 25, 2020 at 9:07pm (CST)
Entering interactive mode (type "help" for commands, "o" for options)
(pprof) top5
Showing nodes accounting for 53.39MB, 100% of 53.39MB total
Showing top 5 nodes out of 13
flat flat% sum% cum cum%
33.10MB 62.00% 62.00% 33.10MB 62.00% main.FindLoops
11.50MB 21.54% 83.54% 11.50MB 21.54% main.NewBasicBlock (inline)
4.50MB 8.43% 91.96% 4.50MB 8.43% main.(*BasicBlock).AddInEdge
2.29MB 4.29% 96.25% 13.79MB 25.83% main.(*CFG).CreateNode
2MB 3.75% 100% 2MB 3.75% main.(*BasicBlock).AddOutEdge
(pprof)
|
flat 和 cum 已经从时间占用变成了存储占用,可以看到 main.FindLoops 占用最多,达到了 62.00%,使用 list 命令查看具体情况
 1
 2
 3
 4
 5
 6
 7
 8
 9
10
11
12
13
14
15
16
17
18
19
20
21
22
23
24
25
26
27
28
29
30
31
32
33
34
35
36
| (pprof) list FindLoops
Total: 53.39MB
ROUTINE ======================== main.FindLoops in F:\Go-web\havlak3.go
33.10MB 33.10MB (flat, cum) 62.00% of Total
. . 261: return
. . 262: }
. . 263:
. . 264: size := cfgraph.NumNodes()
. . 265:
1.97MB 1.97MB 266: nonBackPreds := make([]map[int]bool, size)
5.77MB 5.77MB 267: backPreds := make([][]int, size)
. . 268:
1.97MB 1.97MB 269: number := make([]int, size)
1.97MB 1.97MB 270: header := make([]int, size, size)
1.97MB 1.97MB 271: types := make([]int, size, size)
1.97MB 1.97MB 272: last := make([]int, size, size)
1.97MB 1.97MB 273: nodes := make([]*UnionFindNode, size, size)
. . 274:
. . 275: for i := 0; i < size; i++ {
11MB 11MB 276: nodes[i] = new(UnionFindNode)
. . 277: }
. . 278:
. . 279: // Step a:
. . 280: // - initialize all nodes as unvisited.
. . 281: // - depth-first traversal and numbering.
. . 282: // - unreached BB's are marked as dead.
. . 283: //
. . 284: for i, bb := range cfgraph.Blocks {
. . 285: number[bb.Name] = unvisited
4.50MB 4.50MB 286: nonBackPreds[i] = make(map[int]bool)
. . 287: }
. . 288:
. . 289: DFS(cfgraph.Start, nodes, number, last, 0)
. . 290:
. . 291: // Step b:
(pprof)
|
瓶颈依然在于 UnionFindNode 结构体的初始化和映射。
另外,如果我们执行 go tool pprof 加入 --inuse_objects ,看到的不是内存使用而是调用计数
 1
 2
 3
 4
 5
 6
 7
 8
 9
10
11
12
13
14
15
16
17
18
19
20
21
22
23
24
25
26
27
28
29
30
31
32
33
34
35
36
37
38
39
40
41
| $ go tool pprof --inuse_objects havlak3.exe havlak3.mprof
File: havlak3.exe
Type: inuse_objects
Time: Jul 25, 2020 at 9:07pm (CST)
Entering interactive mode (type "help" for commands, "o" for options)
(pprof) list FindLoops
Total: 1171490
ROUTINE ======================== main.FindLoops in F:\Go-web\havlak3.go
458774 458774 (flat, cum) 39.16% of Total
. . 261: return
. . 262: }
. . 263:
. . 264: size := cfgraph.NumNodes()
. . 265:
1 1 266: nonBackPreds := make([]map[int]bool, size)
1 1 267: backPreds := make([][]int, size)
. . 268:
1 1 269: number := make([]int, size)
1 1 270: header := make([]int, size, size)
1 1 271: types := make([]int, size, size)
1 1 272: last := make([]int, size, size)
1 1 273: nodes := make([]*UnionFindNode, size, size)
. . 274:
. . 275: for i := 0; i < size; i++ {
360459 360459 276: nodes[i] = new(UnionFindNode)
. . 277: }
. . 278:
. . 279: // Step a:
. . 280: // - initialize all nodes as unvisited.
. . 281: // - depth-first traversal and numbering.
. . 282: // - unreached BB's are marked as dead.
. . 283: //
. . 284: for i, bb := range cfgraph.Blocks {
. . 285: number[bb.Name] = unvisited
98308 98308 286: nonBackPreds[i] = make(map[int]bool)
. . 287: }
. . 288:
. . 289: DFS(cfgraph.Start, nodes, number, last, 0)
. . 290:
. . 291: // Step b:
(pprof)
|
这里依然是解决映射使用带来的影响,主要方式是将映射换成切片,这里使用测试文件列表中的 havlak4,可以看到总耗时又少了一点点。
附:diff from havlak3
 1
 2
 3
 4
 5
 6
 7
 8
 9
10
11
12
13
14
15
16
17
18
19
20
21
22
23
24
25
26
27
| $ go build havlak4.go
$ ./havlak4 --cpuprofile=havlak4.prof
# of loops: 76000 (including 1 artificial root node)
$ go tool pprof havlak4.exe havlak4.prof
File: havlak4.exe
Type: cpu
Time: Jul 25, 2020 at 9:25pm (CST)
Duration: 7.35s, Total samples = 13.03s (177.21%)
Entering interactive mode (type "help" for commands, "o" for options)
(pprof) top10
Showing nodes accounting for 8930ms, 68.53% of 13030ms total
Dropped 104 nodes (cum <= 65.15ms)
Showing top 10 nodes out of 84
flat flat% sum% cum cum%
2660ms 20.41% 20.41% 6190ms 47.51% runtime.scanobject
1450ms 11.13% 31.54% 5860ms 44.97% main.FindLoops
1110ms 8.52% 40.06% 1590ms 12.20% runtime.findObject
900ms 6.91% 46.97% 1580ms 12.13% runtime.greyobject
810ms 6.22% 53.18% 3300ms 25.33% runtime.mallocgc
620ms 4.76% 57.94% 820ms 6.29% main.DFS
390ms 2.99% 60.94% 500ms 3.84% runtime.heapBitsSetType
380ms 2.92% 63.85% 510ms 3.91% runtime.spanOf (inline)
310ms 2.38% 66.23% 310ms 2.38% runtime.arenaIndex (partial-inline)
300ms 2.30% 68.53% 300ms 2.30% runtime.memclrNoHeapPointers
(pprof)
|
现在,垃圾回收(runtime.mallocgc)占用 53.18%,我们来查看对它的调用

因为时间占比比较小的调用很多,看不出什么,我们可以在 go tool pprof 中添加 --nodefraction=0.1 参数过滤占用低于 10% 的调用。
1
2
3
4
5
6
7
| $ go tool pprof --nodefraction=0.1 havlak4.exe havlak4.prof
File: havlak4.exe
Type: cpu
Time: Jul 25, 2020 at 9:25pm (CST)
Duration: 7.35s, Total samples = 13.03s (177.21%)
Entering interactive mode (type "help" for commands, "o" for options)
(pprof) web mallocgc
|
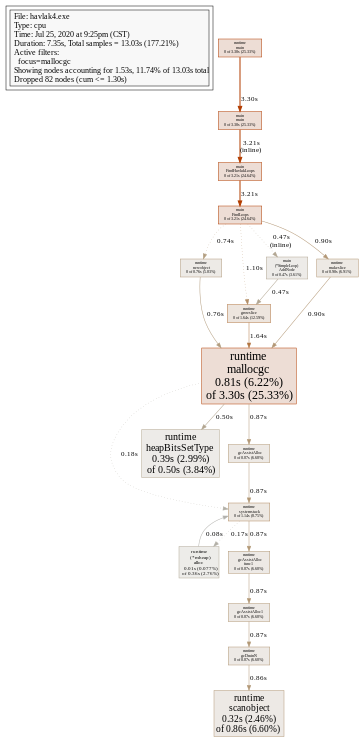
这就非常清楚了,FindLoops 是最主要的占用,然后我们查看它
 1
 2
 3
 4
 5
 6
 7
 8
 9
10
11
12
13
14
15
16
17
18
19
20
21
22
23
| (pprof) list FindLoops
Total: 13.03s
ROUTINE ======================== main.FindLoops in F:\Go-web\havlak4.go
1.45s 5.86s (flat, cum) 44.97% of Total
. . 270: return
. . 271: }
. . 272:
. . 273: size := cfgraph.NumNodes()
. . 274:
. 90ms 275: nonBackPreds := make([][]int, size)
. 210ms 276: backPreds := make([][]int, size)
. . 277:
. 250ms 278: number := make([]int, size)
. 140ms 279: header := make([]int, size, size)
. 80ms 280: types := make([]int, size, size)
. 60ms 281: last := make([]int, size, size)
. 70ms 282: nodes := make([]*UnionFindNode, size, size)
. . 283:
. . 284: for i := 0; i < size; i++ {
10ms 590ms 285: nodes[i] = new(UnionFindNode)
. . 286: }
. . 287:
...
|
每次 FindLoops 被调用,都会进行一系列的初始化工作,为了处理这些内存分配,垃圾回收器的占用才会那么高。所以我们要意识到,语言自带垃圾回收不意味着不需要再关心内存分配问题,这里解决该问题的方法是使用缓存,以便每次不需要重新分配和回收内存。
添加一个全局的结构 cache
 1
 2
 3
 4
 5
 6
 7
 8
 9
10
| var cache struct {
size int
nonBackPreds [][]int
backPreds [][]int
number []int
header []int
types []int
last []int
nodes []*UnionFindNode
}
|
然后在 FindLoops 中每次访问它而不是重新分配(这种方式并不是一种很好的方式,但是确实能在此程序中提升时间)
 1
 2
 3
 4
 5
 6
 7
 8
 9
10
11
12
13
14
15
16
17
18
19
20
21
22
23
24
25
26
27
| if cache.size < size {
cache.size = size
cache.nonBackPreds = make([][]int, size)
cache.backPreds = make([][]int, size)
cache.number = make([]int, size)
cache.header = make([]int, size)
cache.types = make([]int, size)
cache.last = make([]int, size)
cache.nodes = make([]*UnionFindNode, size)
for i := range cache.nodes {
cache.nodes[i] = new(UnionFindNode)
}
}
nonBackPreds := cache.nonBackPreds[:size]
for i := range nonBackPreds {
nonBackPreds[i] = nonBackPreds[i][:0]
}
backPreds := cache.backPreds[:size]
for i := range nonBackPreds {
backPreds[i] = backPreds[i][:0]
}
number := cache.number[:size]
header := cache.header[:size]
types := cache.types[:size]
last := cache.last[:size]
nodes := cache.nodes[:size]
|
这一更改实现在了 havlak5 中,我们从测试文件列表中找到该文件并使用,发现时间占用已经减少到了 10s 以下
附:diff from havlak4
 1
 2
 3
 4
 5
 6
 7
 8
 9
10
11
12
| $ go build havlak5.go
$ ./havlak5.exe --cpuprofile=havlak5.prof
# of loops: 76000 (including 1 artificial root node)
$ go tool pprof havlak5.exe havlak5.prof
File: havlak5.exe
Type: cpu
Time: Jul 25, 2020 at 9:46pm (CST)
Duration: 4.89s, Total samples = 7.34s (150.01%)
Entering interactive mode (type "help" for commands, "o" for options)
(pprof)
|
还有很多的工作可以进行从而使程序更快,但都不需要 pprof 的协助,最终的版本 havlak6 可以减少到 2.29s 和 351M存储占用。
当然,最简单的方式是使用 go test 工具,Go 提供的测试机制可以很容易的提供 CPU 和存储的占用分析。
3. 分析网络程序
就像我们一开始说的,分析一个网络程序更加的简单,只需要导入 net/http/pprof 包即可,不需要在程序中使用,只需要添加这一条导入语句。
1
| import _ "net/http/pprof"
|
导入该包会添加一些 /debug/pprof/ URL 下面的一些处理器函数,之后简单的运行 go tool pprof 然后添加服务器 URL就会实时的检查配置文件。
以我们之前写的一个文件上传下载应用为例,端口使用 8090,添加导入语句后,打开浏览器 http://localhost:8090/debug/pprof/,显示如下

或者在命令行使用 go tool pprof 命令
1
2
3
| go tool pprof http://localhost:8090/debug/pprof/profile # 30-second CPU profile
go tool pprof http://localhost:8090/debug/pprof/heap # heap profile
go tool pprof http://localhost:8090/debug/pprof/block # goroutine blocking profile
|
进入 pprof 命令行界面后就和前面的使用没有区别了,这几个文件简单介绍如下
/debug/pprof/profile:访问这个链接会自动进行 CPU profiling,持续 30s,并生成一个文件供下载/debug/pprof/heap: Memory Profiling 的路径,访问这个链接会得到一个内存 Profiling 结果的文件/debug/pprof/block:block Profiling 的路径
最后,上面的导入形式是基于我们使用默认的 http.DefaultServeMux 的情况,如果使用了其它的包,比如 Mux,需要手动添加路由规则
1
2
3
4
5
| r.HandleFunc("/debug/pprof/", pprof.Index)
r.HandleFunc("/debug/pprof/cmdline", pprof.Cmdline)
r.HandleFunc("/debug/pprof/profile", pprof.Profile)
r.HandleFunc("/debug/pprof/symbol", pprof.Symbol)
r.HandleFunc("/debug/pprof/trace", pprof.Trace)
|
之后的使用就没有区别了。
 支付宝
支付宝 微信
微信